
Revenue analytics
Track total revenue, average daily rate, and revenue per property across all booking sources. See trends over time.
Track performance across every channel in one place — RevPAR, occupancy, ADR, and benchmarks against comparable properties. Ask questions in plain language and get instant answers from your AI co-pilot.
How's your portfolio performing? Which properties generate the most revenue? What's your average occupancy rate this quarter? Which booking source delivers the best return?
Most hosts can't answer these questions without spending hours in spreadsheets. OTA dashboards show partial data — Airbnb shows Airbnb numbers, Booking.com shows Booking.com numbers. There's no unified view.
Standalone analytics tools like AirDNA cost $20+/month and only show market data — not your actual business performance.
SympleHost Analytics gives you a complete picture of your hosting business. Revenue across all platforms, occupancy rates by property, booking source performance, operations efficiency — all in one place.
Because every part of your business lives in SympleHost, analytics sees everything. Not just booking data — but operations costs, guest communication patterns, direct vs. OTA revenue, and team performance.
And with the AI Co-Pilot, you don't need to build reports. Just ask: "What was my occupancy rate last month?" or "Which property generated the most revenue this quarter?" Get instant, accurate answers in plain language.
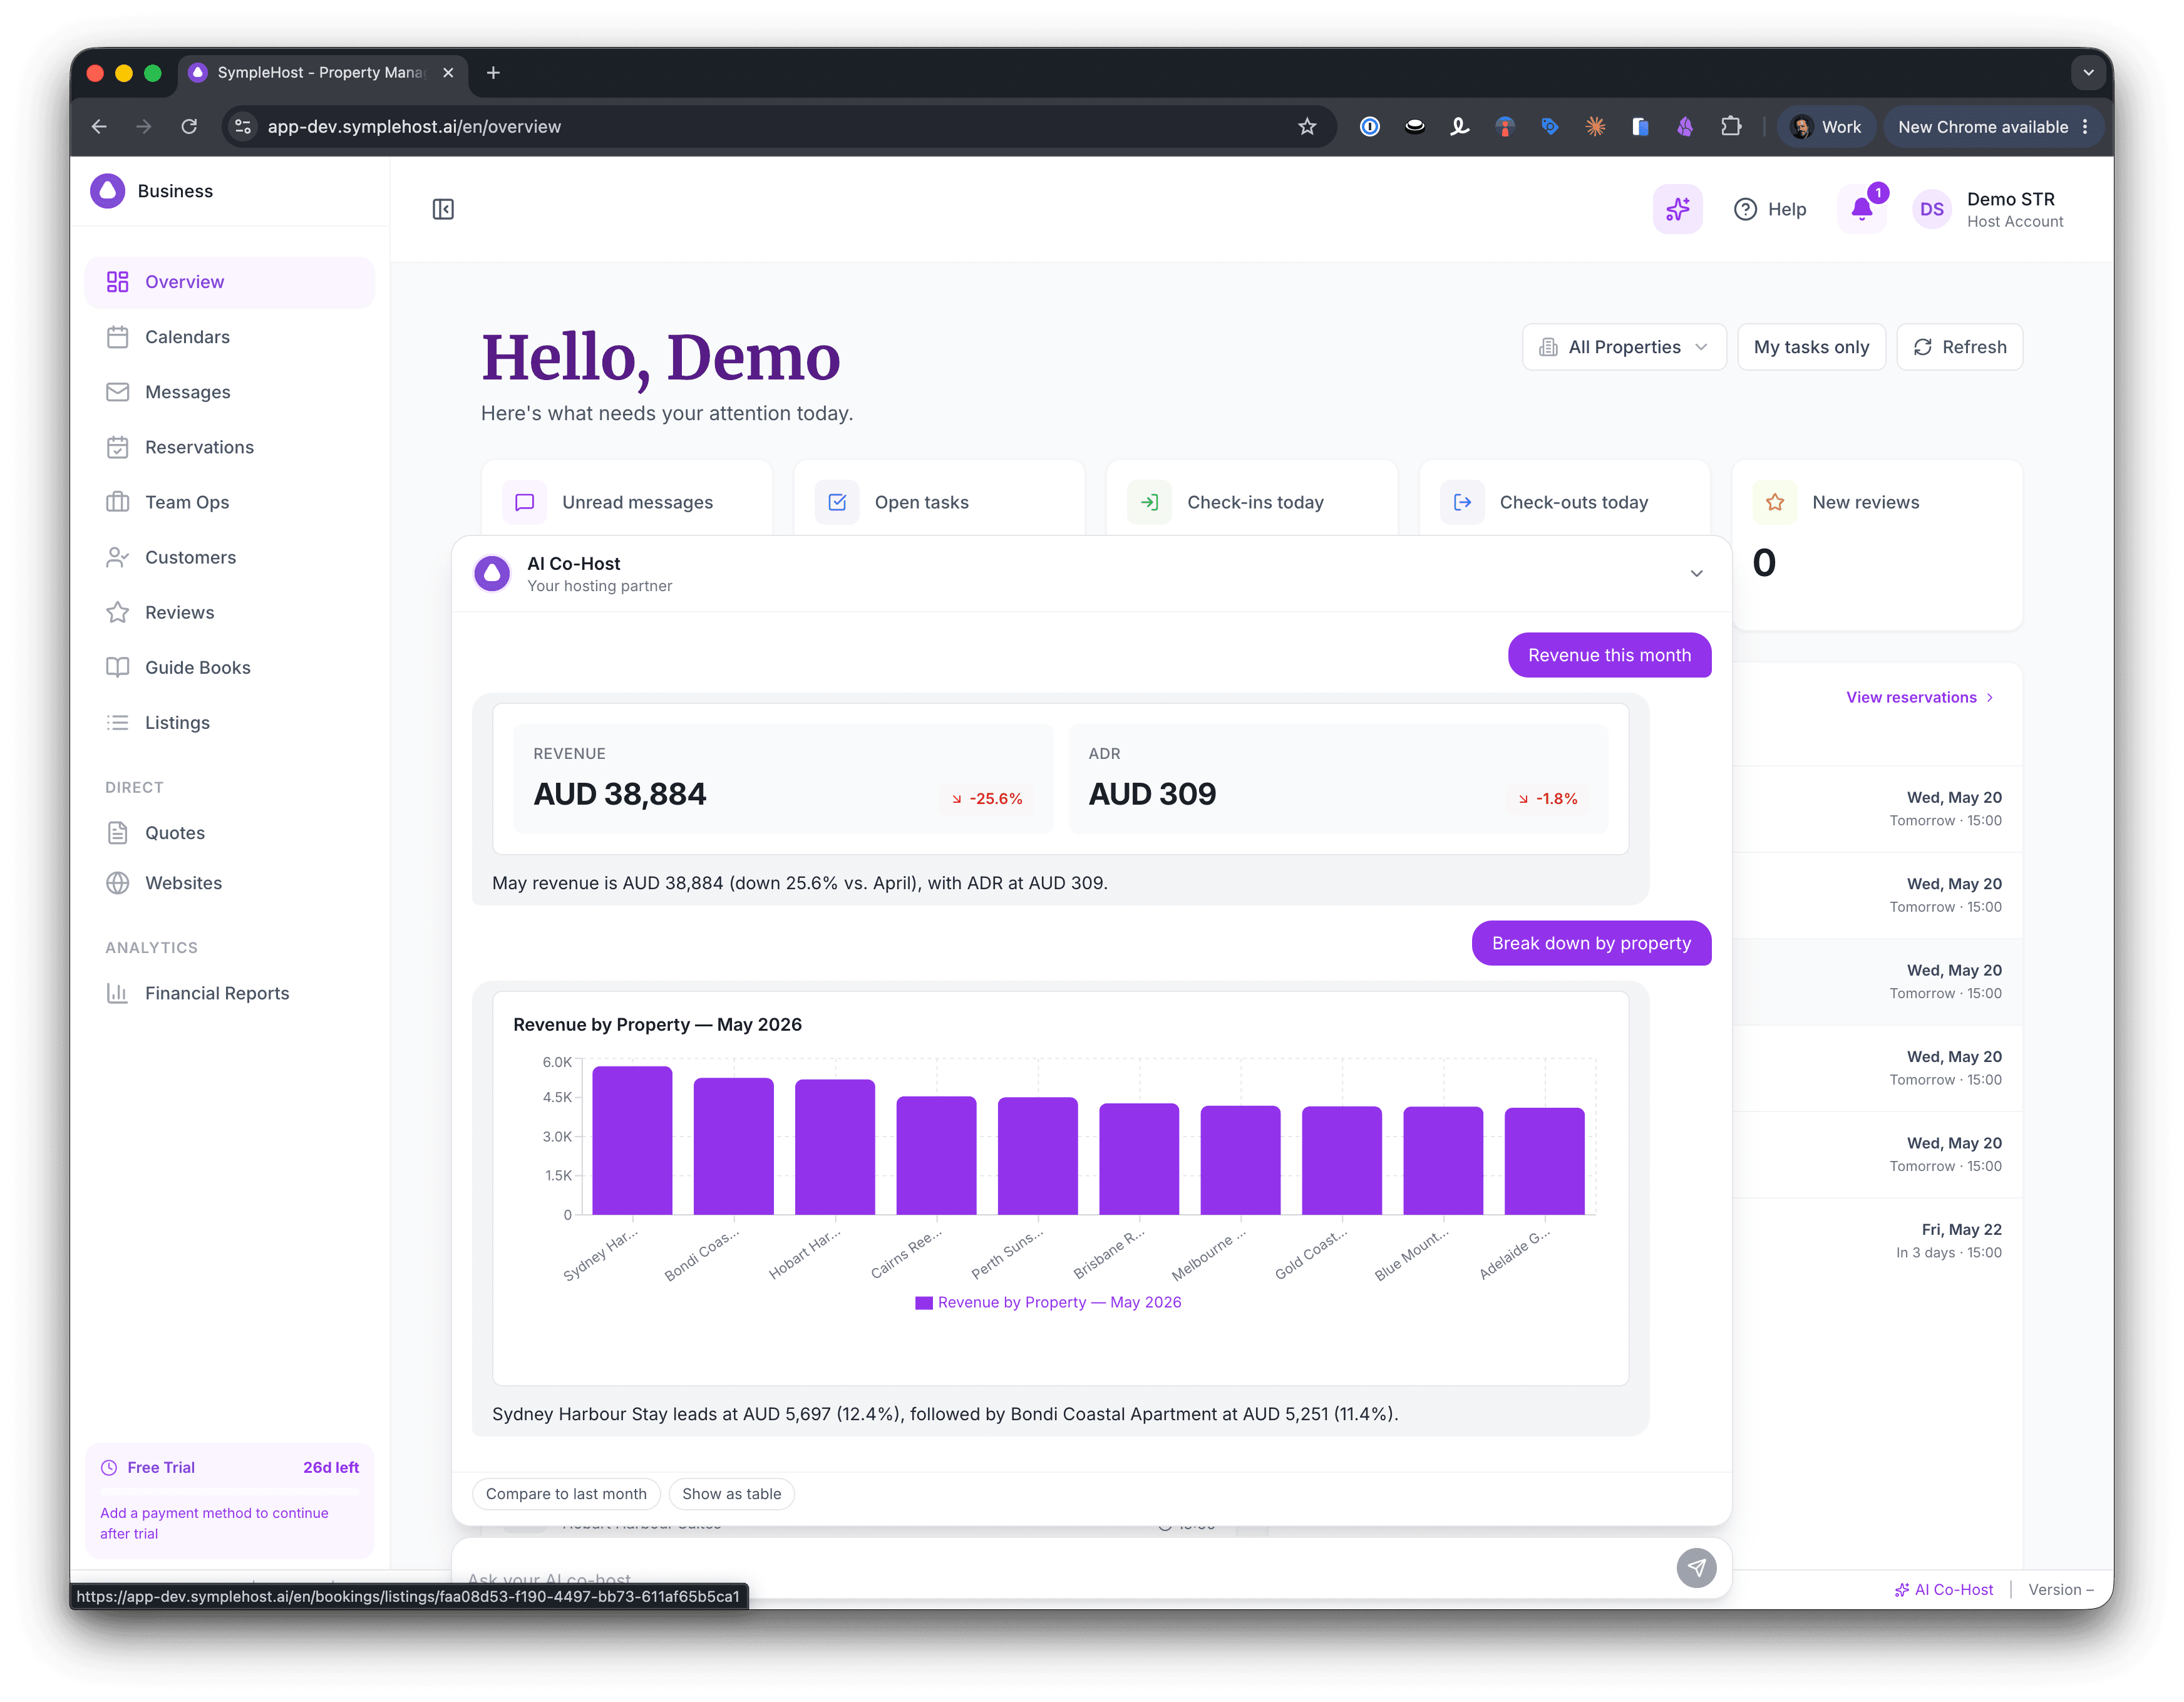
Track total revenue, average daily rate, and revenue per property across all booking sources. See trends over time.
Monitor occupancy rates by property, by month, by booking source. Identify underperforming properties and seasonal patterns.
See exactly how many bookings and how much revenue comes from Airbnb vs. Booking.com vs. VRBO vs. direct bookings.
Ask questions about your data in plain language. The co-pilot queries your actual business data and returns answers instantly.
Track task completion rates, average turnover time, and team performance alongside financial metrics.
Compare performance across your portfolio. Identify top performers and properties that need attention.
Standalone analytics tools only see what you feed them. AirDNA shows market trends but not your actual revenue. Airbnb's dashboard shows Airbnb data but not Booking.com. SympleHost Analytics is different because it's native to the platform:
One source of truth. No data export. No spreadsheet assembly. No separate analytics subscription. Save $20+/month on standalone analytics tools.
Because all your bookings, revenue, and operations flow through SympleHost, analytics is ready from day one. No setup needed.
Browse pre-built reports for revenue, occupancy, booking sources, and operations. Filter by property, date range, or platform.
Need a specific insight? Ask the AI Co-Pilot in plain language. Get instant answers based on your actual business data.
Unified analytics and AI co-pilot — all included in your PMS. Start your 14-day trial today.
We use cookies to improve your experience and measure site performance. Privacy Policy